Solver Reporting has a new feature called “Period Aggregation” in Layout Editor and this article provides more foundational knowledge.
Here is an example to demonstrate this new feature.
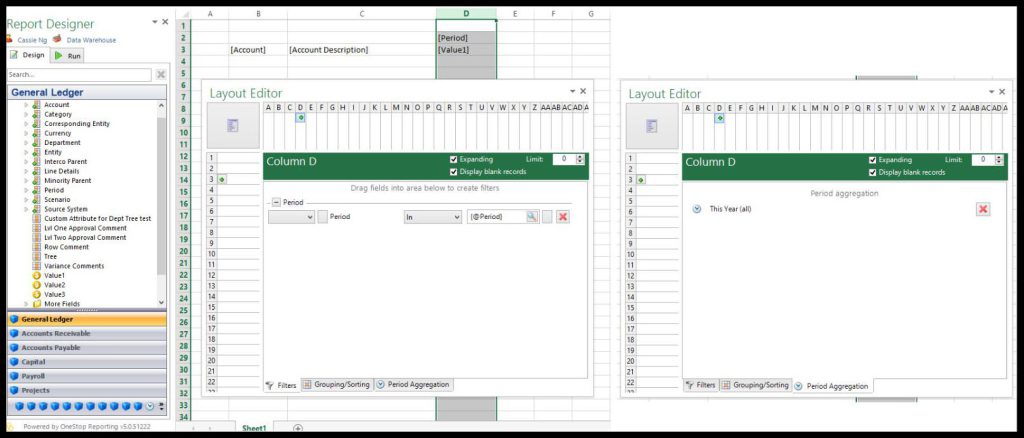
In this sample report, we have a single column that is referencing the @Period parameter in the Filters tab. We then drag in a Period Function “This Year (All) into the new Period Aggregation tab and have this column set to Expanding.
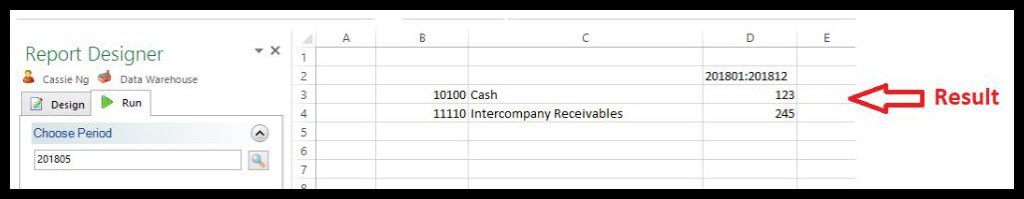
Then we run the report for 201805. Although this column is set to Expanding, when we run the report, the report pulls in a single column with a sum total titled 201801:201812 instead of 12 columns with each period’s total.